URL: guardian.co.uk/datablog/…infovis (fullscreen version)
There’s been a lot of discussion recently about public spending, amidst a global recession, countries in crisis and the emergency budget.
The Guardian has been following this closely and, when the UK Treasury released “Coins“, its huge database of Government spending, the Guardian invited a small group of programmers and experts to work with them and help unravel the hidden stories buried beneath the data.
Brought in by Rewired State, I worked with others from the Open Knowledge Foundation and MySociety on data visualisations and articles for the Guardian Data Blog.
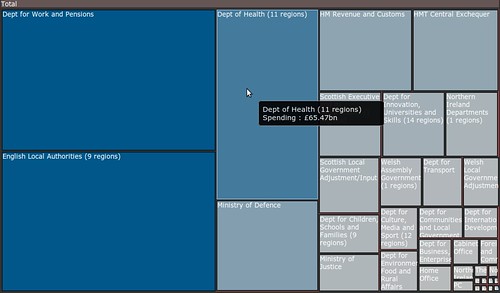
Expenditure per Government department
This interactive visualisation, which I created with Rufus Pollock, shows the relative amounts of spending, per Government department. You can left-click a department to see the distribution of spending per geographical region (and right-click to get back again).
It’s worth seeing this fullscreen, to catch the numerous small departments.
This type of visualisation is called a “tree map” and is written in pure JavaScript, with the help of an excellent piece of open-source software, the JIT.
The Coins Explorer

I also produced an article for web developers, about getting more from the Coins Explorer. The Explorer lets you search for particular types of spending, and export subsets of the data to use elsewhere. It was pulled together by the Guardian’s razor-sharp team of developers in just a matter of hours.
Appreciation
Big thanks go out to Emma from Rewired State, Mike, Simon, Giles, Michael, Daniel and Matt from the Guardian, and all the developers there with us.
4 Comments
Excellent. I was wondering when someone was going to make a visualisation like this.
J.
There are very interesting way of visualization.I’ll will no doubt try them in my research
I was wondering when someone was going to make a visualisation like this.
very nice visualisation