
Peter Cook is a software developer from Lewes, East Sussex. He took part in our recent Data Visualisation Lab Days, where we brought together a melting pot of designers, programmers and others, working together to produce visual, interactive tools that make use of real world data to help elucidate problems and facilitate change. For a different take on the Lab Days, see Jaya Brekke’s post on visualising the social impact of the economic crisis in Greece.
I’ve been attending the Data Visualisation Lab Days at L4RP and it’s sparked off a revisit to an old project. I logged energy data from an energy monitor for a few months and used the flot library to draw daily graphs of my electricity consumption.
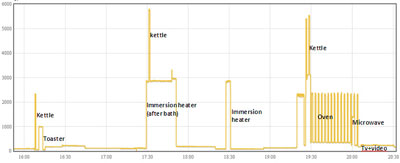
It was very revealing and helped me reduce my consumption significantly. However, I was aware that the graphs require a fair degree of analysis and interpretation and require an experienced eye to read them. So probably not that revealing to most people.
I spent a lot of time trying to develop an algorithm to identify patterns in the data so that information such as: ‘your kettle is costing you x pence a week’ but to no avail.
However, after attending a lab session at L4RP and finding out about the D3.js library there, I had another think about how the energy data can be presented. The result is a circular (or doughnut?) graph showing a week’s usage.
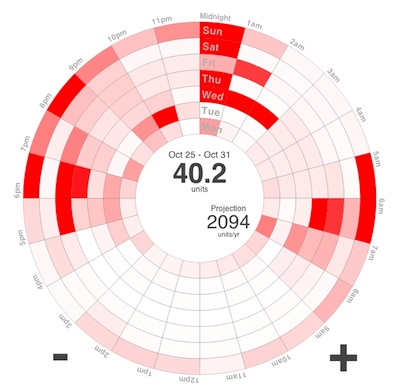
Each of the seven circles represents a day and each day is subdivided into 24 hours. Each segment represents an hour and its colour intensity is proportional to the amount of electricity used in that hour.
The user can instantly see when a significant amount of energy has been used. In the view above, for example, you can see where a storage heater has been turning on at midnight. Such ‘invisible’ use of energy whilst most people are asleep would usually be hard to track down.
(This post first appeared on Peter’s blog)